WASSCE past question

Economics 2026 Paper 2

WASSCE Economics

Section A — instructions

Answer one question only from this section.

1. [3]

WASSCE 2026 · Paper 2

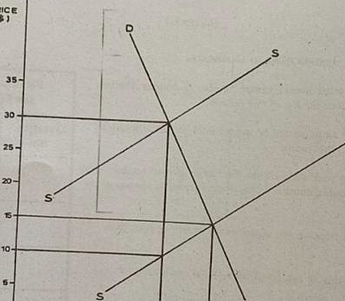
Figure 1 shows the equilibrium positions in a market before and after the imposition of an excise duty. Using the figure, calculate the firm's total revenue before the imposition of the excise duty.
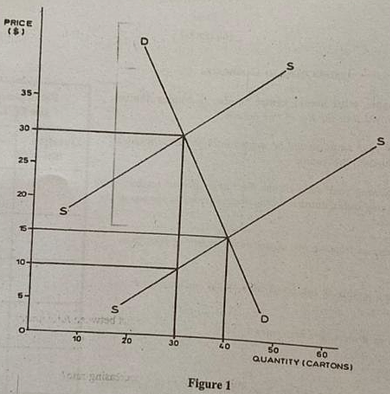
Diagram for question 1
2. [3]

WASSCE 2026 · Paper 2

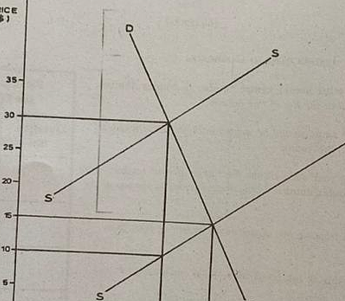
Figure 1 shows the equilibrium positions in a market before and after the imposition of an excise duty. Using the figure, calculate the firm's total revenue after the imposition of the excise duty.
Diagram for question 2
3. [2]

WASSCE 2026 · Paper 2

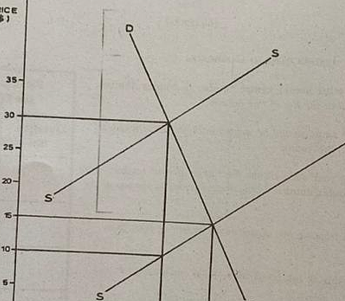
Figure 1 shows the equilibrium positions in a market before and after the imposition of an excise duty. Using the figure, calculate the percentage increase or decrease in the firm's total revenue after the imposition of the excise duty.
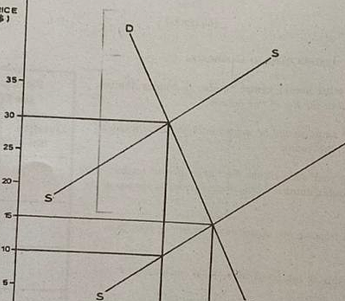
Diagram for question 3
4. [3]

WASSCE 2026 · Paper 2

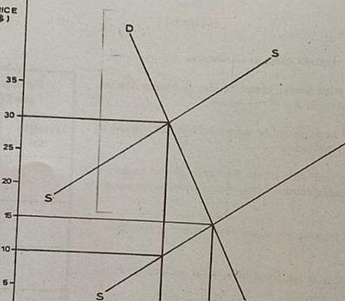
Figure 1 shows the equilibrium positions in a market before and after the imposition of a USD 20.00 excise duty. Using the figure, calculate how much of the excise duty is borne by the producer.
Diagram for question 4
5. [3]

WASSCE 2026 · Paper 2

Figure 1 shows the equilibrium positions in a market before and after the imposition of a USD 20.00 excise duty. Using the figure, calculate how much of the excise duty is borne by the buyer.
Diagram for question 5
6. [3]

WASSCE 2026 · Paper 2

Figure 1 shows the equilibrium positions in a market before and after the imposition of a USD 20.00 excise duty. Using the figure, calculate the percentage of the excise duty borne by the producer.
Diagram for question 6
7. [3]

WASSCE 2026 · Paper 2

Figure 1 shows the equilibrium positions in a market before and after the imposition of a USD 20.00 excise duty. Using the figure, calculate the percentage of the excise duty borne by the buyer.
Diagram for question 7
8. [8]

WASSCE 2026 · Paper 2

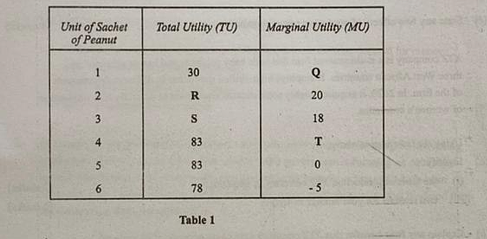
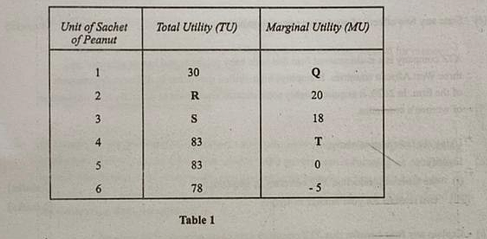
The table shows the total and marginal utilities a consumer receives as her consumption of peanut increases. Peanut is sold for USD 15 per sachet. Using the table, calculate the values represented by Q, R, S and T.
Diagram for question 8
9. [2]

WASSCE 2026 · Paper 2

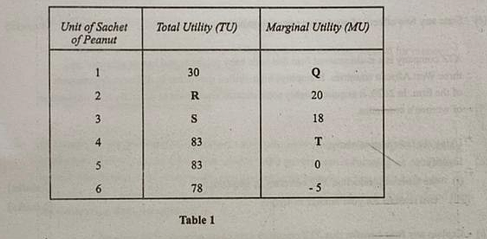
The table shows the total and marginal utilities a consumer receives as her consumption of peanut increases. Using the table, identify any two relationships between total utility and marginal utility.
Diagram for question 9
10. [2]

WASSCE 2026 · Paper 2

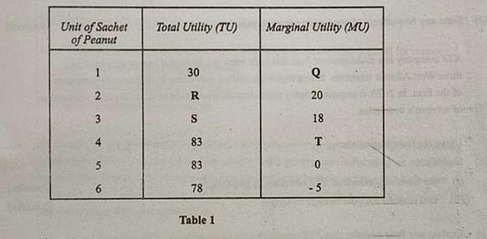
The table shows the total and marginal utilities a consumer receives as her consumption of peanut increases. Using the table, state the range of consumption over which total utility is increasing at a decreasing rate.
Diagram for question 10
11. [4]

WASSCE 2026 · Paper 2

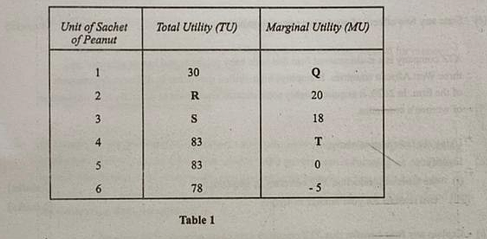
The table shows the total and marginal utilities a consumer receives as her consumption of peanut increases, and peanut is sold for USD 15 per sachet. Using the table, determine the unit of consumption at which a rational consumer will be in equilibrium and give a reason for your answer.
Diagram for question 11
12. [2]

WASSCE 2026 · Paper 2

The table shows the total and marginal utilities a consumer receives as her consumption of peanut increases, and peanut is sold for USD 15 per sachet. State one factor that could cause the consumer to increase consumption beyond the equilibrium quantity shown by the table.
Diagram for question 12
13. [2]

WASSCE 2026 · Paper 2

The table shows the total and marginal utilities a consumer receives as her consumption of peanut increases. Explain the effect of consuming the 6th sachet on the consumer.
Diagram for question 13

Section B — instructions

Answer three questions only from this section.

14. [4]

WASSCE 2026 · Paper 2

Differentiate between a free market and a regulated market.
15. [3]

WASSCE 2026 · Paper 2

If labour is a major input in the production of hand sanitizer, explain the likely effect of an increase in the minimum wage on the quantity of labour employed.
16. [3]

WASSCE 2026 · Paper 2

If labour is a major input in the production of hand sanitizer, explain the likely effect of an increase in the minimum wage on the supply of hand sanitizer.
17. [3]

WASSCE 2026 · Paper 2

If labour is a major input in the production of hand sanitizer, explain the likely effect of an increase in the minimum wage on the price of hand sanitizer.
18. [3]

WASSCE 2026 · Paper 2

If labour is a major input in the production of hand sanitizer, explain the likely long-run effect of an increase in the minimum wage on the price of a substitute for hand sanitizer.
19. [4]

WASSCE 2026 · Paper 2

State any two effects of maximum price regulation.
20. [2]

WASSCE 2026 · Paper 2

XYZ Company is a multinational firm that sells baby products and operates in three West African countries. It employs highly skilled specialists in different departments and has acquired sophisticated equipment to diversify into women's cosmetics. Identify the scale of production at which XYZ Company is operating.
21. [2]

WASSCE 2026 · Paper 2

XYZ Company is a multinational firm that sells baby products and operates in three West African countries. It employs highly skilled specialists in different departments and has acquired sophisticated equipment to diversify into women's cosmetics. State two reasons why the company can be classified as operating at that scale of production.
22. [12]

WASSCE 2026 · Paper 2

XYZ Company is a multinational firm that sells baby products and operates in three West African countries. It employs highly skilled specialists in different departments and has acquired sophisticated equipment to diversify into women's cosmetics. Explain any four benefits the company may enjoy because of its scale of production.
23. [4]

WASSCE 2026 · Paper 2

Differentiate between division of labour and specialization of labour.
24. [4]

WASSCE 2026 · Paper 2

Distinguish between the revenue of a firm and government revenue.
25. [4]

WASSCE 2026 · Paper 2

Using a formula, show the relationship between average revenue and price in a perfectly competitive market.
26. [4]

WASSCE 2026 · Paper 2

Explain why the marginal revenue of a monopolist is usually lower than its price.
27. [8]

WASSCE 2026 · Paper 2

Outline any four sources of government non-tax revenue.
28. [2]

WASSCE 2026 · Paper 2

Define national income.
29. [3]

WASSCE 2026 · Paper 2

With an example, explain the national income concept of value added.
30. [3]

WASSCE 2026 · Paper 2

With an example, explain the national income concept of transfer payment.
31. [3]

WASSCE 2026 · Paper 2

With an example, explain the national income concept of per capita income.
32. [9]

WASSCE 2026 · Paper 2

Explain how Net National Product at factor cost (NNPfc) is obtained from Gross Domestic Product at market prices (GDPmp).
33. [2]

WASSCE 2026 · Paper 2

Define barter trade.
34. [9]

WASSCE 2026 · Paper 2

Explain any three problems associated with barter trade.
35. [3]

WASSCE 2026 · Paper 2

Describe how an individual's level of income affects the transactions demand for money.
36. [3]

WASSCE 2026 · Paper 2

Describe how the interval between pay days affects the transactions demand for money.
37. [3]

WASSCE 2026 · Paper 2

Describe how the general price level affects the transactions demand for money.
38. [2]

WASSCE 2026 · Paper 2

Country P has introduced a five-year economic plan aimed at increasing production and real output. Define an economic plan.
39. [6]

WASSCE 2026 · Paper 2

Country P has introduced a five-year economic plan aimed at increasing production and real output. State three ways through which the country can achieve this economic goal.
40. [12]

WASSCE 2026 · Paper 2

Country Q is pursuing a long-term economic plan focused on equitable income distribution, improved health care and poverty reduction. Explain any four factors that could hinder Country Q from achieving this goal.

More Economics