WASSCE past question

Economics 2025 Paper 3

WASSCE Economics paper 2

Section A — instructions

Answer one question only from this section.

1. [4]

WASSCE 2025 · Paper 3

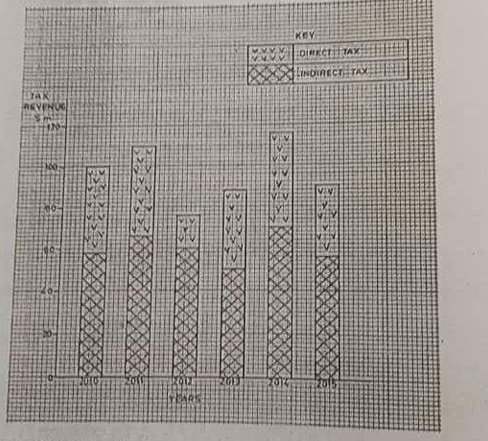
The figure shows the country's direct and indirect tax revenue from 2010 to 2015. Using the figure, calculate the total direct tax revenue collected over the entire period.
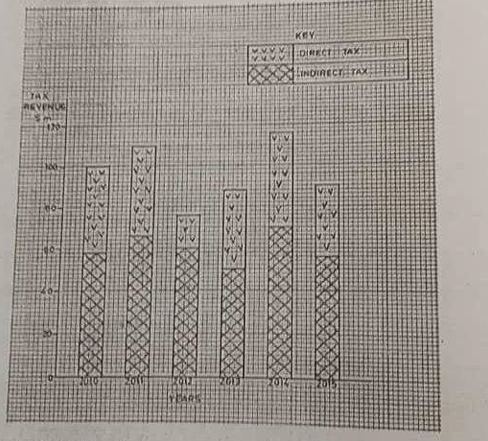
Diagram for question 1
2. [4]

WASSCE 2025 · Paper 3

The figure shows the country's direct and indirect tax revenue from 2010 to 2015. Using the figure, calculate the total indirect tax revenue collected over the entire period.
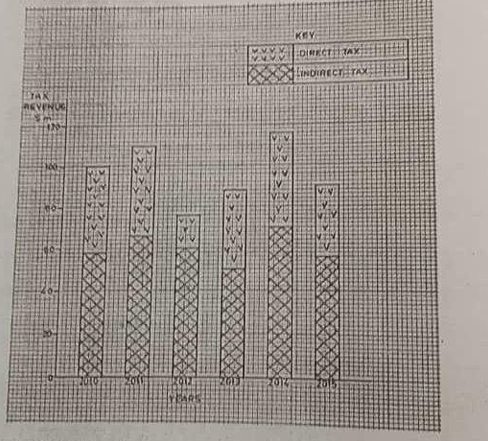
Diagram for question 2
3. [2]

WASSCE 2025 · Paper 3

The figure shows the country's direct and indirect tax revenue from 2010 to 2015. Identify the year that recorded the highest amount of direct tax and explain your answer.
Diagram for question 3
4. [6]

WASSCE 2025 · Paper 3

The figure shows the country's direct and indirect tax revenue from 2010 to 2015. Express the total direct tax revenue as a percentage of the total tax revenue collected over the entire period.
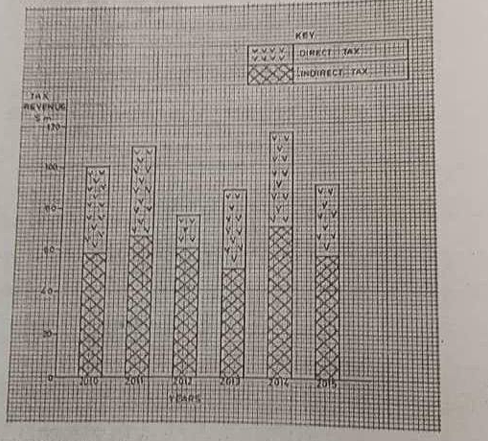
Diagram for question 4
5. [4]

WASSCE 2025 · Paper 3

Differentiate between a direct tax and an indirect tax.
6. [4]

WASSCE 2025 · Paper 3

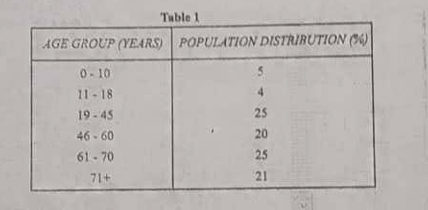
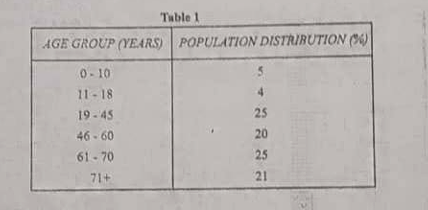
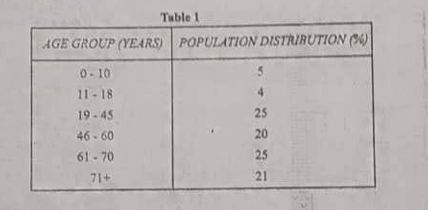
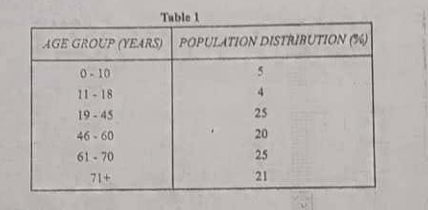
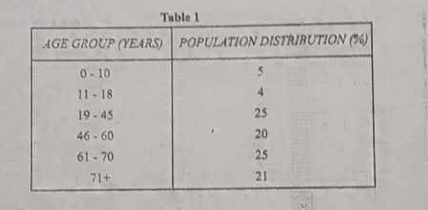
The table shows the population distribution of a hypothetical country in 2020. The total population is 40 million and the birth rate is 0.8%. Using the table, calculate the total youthful population.
Diagram for question 6
7. [4]

WASSCE 2025 · Paper 3

The table shows the population distribution of a hypothetical country in 2020. The total population is 40 million and the birth rate is 0.8%. Using the table, calculate the total working population.
Diagram for question 7
8. [4]

WASSCE 2025 · Paper 3

The table shows the population distribution of a hypothetical country in 2020. The total population is 40 million and the birth rate is 0.8%. Using the table, calculate the total aged population.
Diagram for question 8
9. [3]

WASSCE 2025 · Paper 3

The table shows the population distribution of a hypothetical country in 2020. The total population is 40 million and the birth rate is 0.8%. Calculate the total number of births in the country.
Diagram for question 9
10. [3]

WASSCE 2025 · Paper 3

The table shows the population distribution of a hypothetical country in 2020. The total population is 40 million and the birth rate is 0.8%. If 60% of the working population emigrates, calculate the number of working people left in the country.
Diagram for question 10
11. [2]

WASSCE 2025 · Paper 3

A hypothetical country has a total population of 40 million. If the total number of births in 2021 is 500,000, calculate the new birth rate.

Section B — instructions

Answer three questions only from this section.

12. [3]

WASSCE 2025 · Paper 3

Define a production possibility curve.
13. [10]

WASSCE 2025 · Paper 3

[Image Required] Draw a production possibility curve and indicate one point on the curve labelled M to represent fully utilized resources, one point inside the curve labelled Q to represent underutilized resources, and one point outside the curve labelled T to represent an unattainable combination.
14. [2]

WASSCE 2025 · Paper 3

[Image Required] Draw a production possibility curve and then show, with a second curve, an increase in the production capacity for both goods.
15. [5]

WASSCE 2025 · Paper 3

Explain why a production possibility curve has a negative slope.
16. [2]

WASSCE 2025 · Paper 3

Define a wholesaler as an agent in the chain of distribution.
17. [2]

WASSCE 2025 · Paper 3

Define a retailer as an agent in the chain of distribution.
18. [12]

WASSCE 2025 · Paper 3

Explain four problems associated with the distribution of goods in a country.
19. [4]

WASSCE 2025 · Paper 3

Suggest solutions to any two common problems associated with the distribution of goods in a country.
20. [4]

WASSCE 2025 · Paper 3

Explain the effect on the demand for good X when the price of a complementary good Y increases. No diagram is required.
21. [4]

WASSCE 2025 · Paper 3

Explain the effect on the demand for good X when consumers' tastes change in favour of good X. No diagram is required.
22. [4]

WASSCE 2025 · Paper 3

Explain the effect on the demand for good X when consumers' incomes fall and good X is an inferior good. No diagram is required.
23. [4]

WASSCE 2025 · Paper 3

Explain the effect on the current demand for good X when consumers expect the price of good X to fall in the near future. No diagram is required.
24. [4]

WASSCE 2025 · Paper 3

Explain the effect on the demand for good X when the price of a substitute good P increases. No diagram is required.
25. [2]

WASSCE 2025 · Paper 3

Define price elasticity of supply.
26. [12]

WASSCE 2025 · Paper 3

[Image Required] With the aid of diagrams, distinguish between elastic supply and inelastic supply.
27. [6]

WASSCE 2025 · Paper 3

State any three factors that can influence the price elasticity of supply of a product.
28. [2]

WASSCE 2025 · Paper 3

Define subsistence farming.
29. [9]

WASSCE 2025 · Paper 3

Outline three roles of agriculture in the socio-economic development of a country.
30. [9]

WASSCE 2025 · Paper 3

Explain three problems faced by commercial farmers in a country.
31. [4]

WASSCE 2025 · Paper 3

State any two roles of the International Monetary Fund (IMF).
32. [8]

WASSCE 2025 · Paper 3

Explain any four achievements of the Organization of Petroleum Exporting Countries (OPEC).
33. [8]

WASSCE 2025 · Paper 3

Identify any four problems confronting the Organization of Petroleum Exporting Countries (OPEC).

More Economics